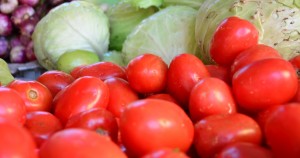
Vegetables hike Uganda’s inflation to 6.7%
February 28-The recent long dry spell had its toll on Uganda’s food production and especially vegetables, as prices rose and sent the Annual Headline Inflation upwards to near 7%.
The headline rate went from 5.9% for the year ending January 2017 to 6.7% ending February 2017. However the Annual Core Inflation increased to 5.7 percent for the year ending February 2017 compared to 5.3 percent experienced the previous month.
According the latest Uganda Consumer Price Index issued by the Uganda Bureau of Statistics, (UBOS), the increase was due to Annual Food Crops inflation that rose to 18.8% for the year ending February 2017 compared to 14.5% recorded in January 2017.
In its report UBOS states; “The rise in Annual Food Crops Inflation is mainly due to the vegetables inflation that increased to 13.3% for the year ending February 2017 compared to 6.5% during the year ending January 2017’
UBOS provides the monthly Consumer Price Indices for Uganda (Composite) and for the 10 baskets of Kampala High Income, Kampala Middle Income, Kampala Low Income, Jinja, Mbale, Masaka, Mbarara, Fort Portal, Gulu and Arua. All the baskets are for the urban households.
The current Consumer Price Index was re-based from 2005/2006 to 2009/2010, using weights derived from the Uganda National Household Survey (UNHS IV) that was conducted from May 2009 to April 2010. During the re-basing exercise, Kampala was further decomposed into three baskets from the two that has been existing. In addition, Fort Portal Centre, (in western Uganda) was incorporated into the Index. The re-based CPI is now classified using international standards, referred to as Classification of Individual Consumption.
The Annual Energy, Fuels and Utilities (EFU) Inflation declined to one percent for the year ending February 2017 compared to 1.4 percent recorded at the end of January. The driver for the decline was Annual Inflation for Solid Fuels that recorded minus 2.1 percent for the year ending February 2017 compared to 2.4 percent rise recorded for the year ended January 2017. In particular, Charcoal Inflation declined to minus 2.2 percent in February 2017 compared to 2.8 percent rise recorded in January 2017.
The rate for Restaurants and Hotels rose to 9.1 percent for the year ending February 2017 compared to 7.2 percent. This was as a result of higher Annual Inflation for Food and Non-Alcoholic Beverages that registered 14.5 percent compared to 9.2 percent the previous month. In addition, Furnishings, Household Equipment and Routine Household Maintenance recorded an annual inflation of 6.5 per cent for the year ending February 2017 compared to minus 2.5 percent for the year ended January 2017.


 African Heads of state head to South Korea next week for Summit talks
 Trading leads as main source of income for Ugandans
 New leadership for bankers’ umbrella as total assets top $12 billion
 Brussels Airlines to announce Nairobi service
 SITA promises enhanced travel experience after Materna acquisition
 Saudia’s 105 aircraft order stretches A320neo lead over rival Max
